

This page was used to document project progress over the course of ATLS 4010: Capstone Projects
Related Links: fishcity.co (not yet published) | Project Proposal
Project Overview
Elevator Pitch:
An online education platform centered around connecting existing educational resources into a navigable “city” visualization.
Description:
fishcity is an online education platform built around the idea of connection and navigation of existing content. Typical online education platforms center around the creation of exclusive content. Locked behind a paywall, the website supports itself with paid memberships. I believe this model is flawed and leads to the creation of redundant and restricted content.
fishcity’s users aggregate links to educational content from across the web and the platform serves as a tool for navigating that content. Resources are structured as a city, similar subjects forming neighborhoods.
In the future users will be able to navigate the paths through the “city” or browse, documenting their learning with projects along the way.
Currently in the process of cleaning up the code and experimenting with the UI/X around navigating the visualization.
Development Progress:
Dev Notes
Pandemic Weeks: 3/10 -> 4/28
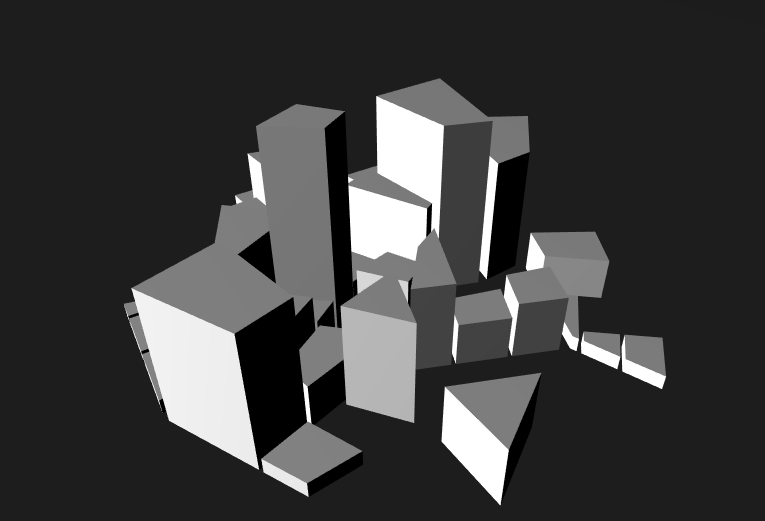
Hi there. Been a minute. A lot's changed. The worlds gone a bit nuts. Anyways, I have a city!
and a basic UI!
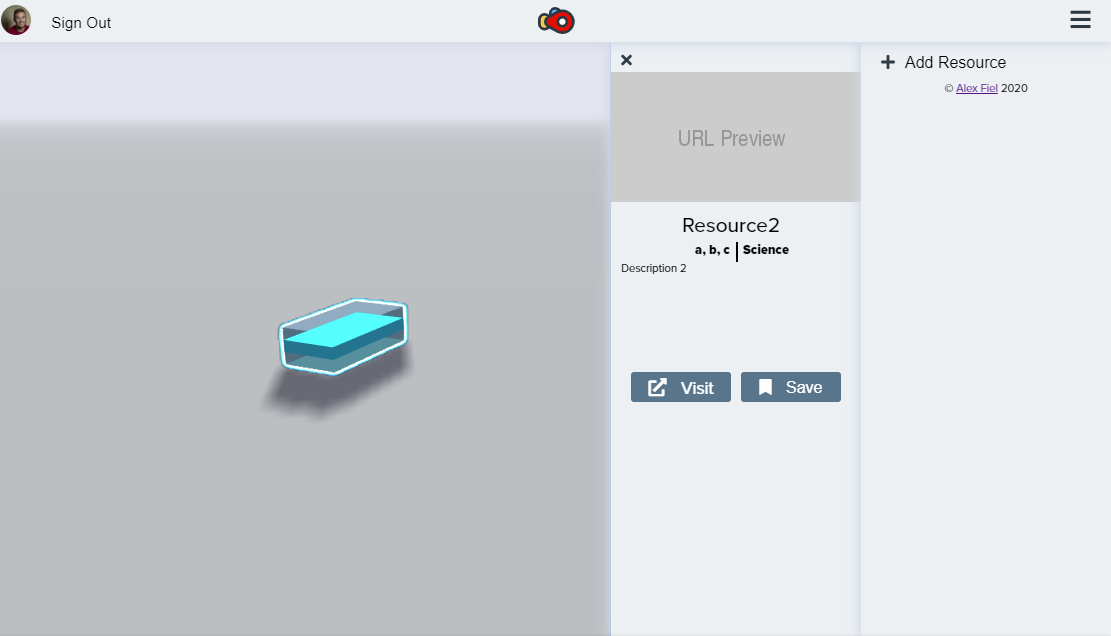
and animations!
and ( ideas of what ) paths ( could look like )!
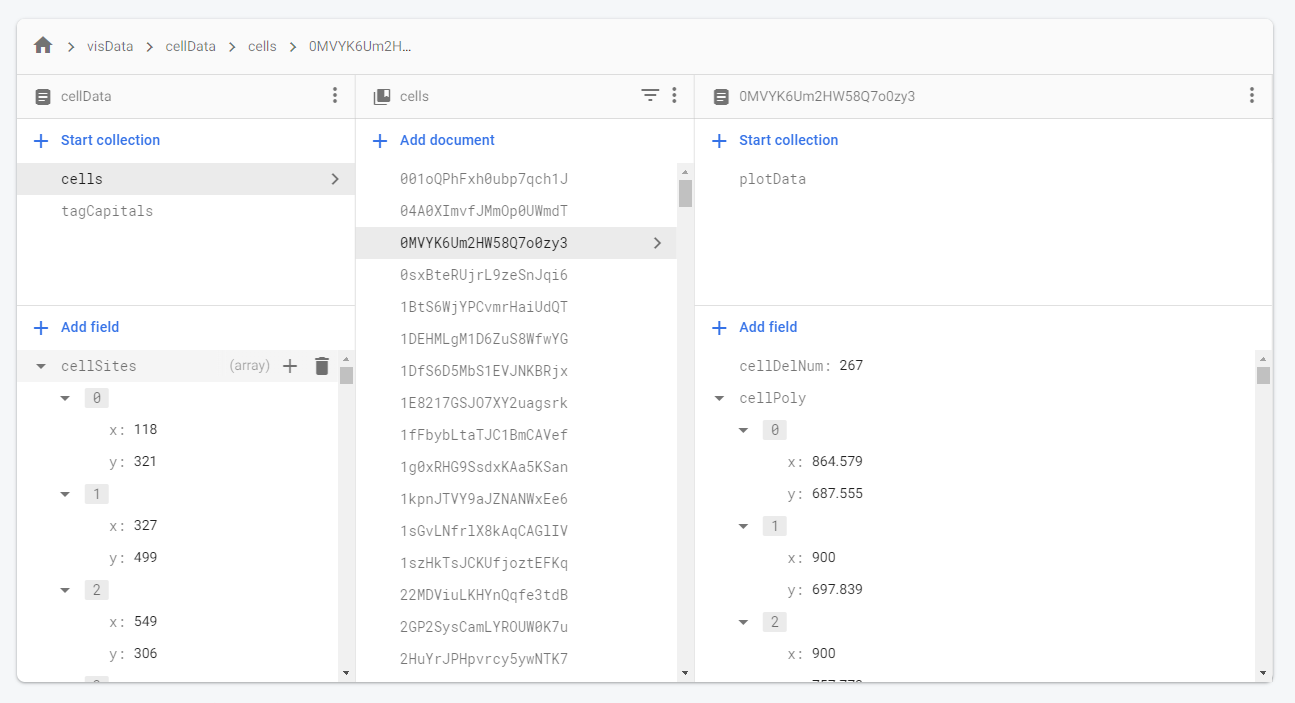
all of it on Firebase!
Week 9: 3/3 -> 3/10
This week, the whole thing started looking like a city. I finished the OBB splitting algorithm...
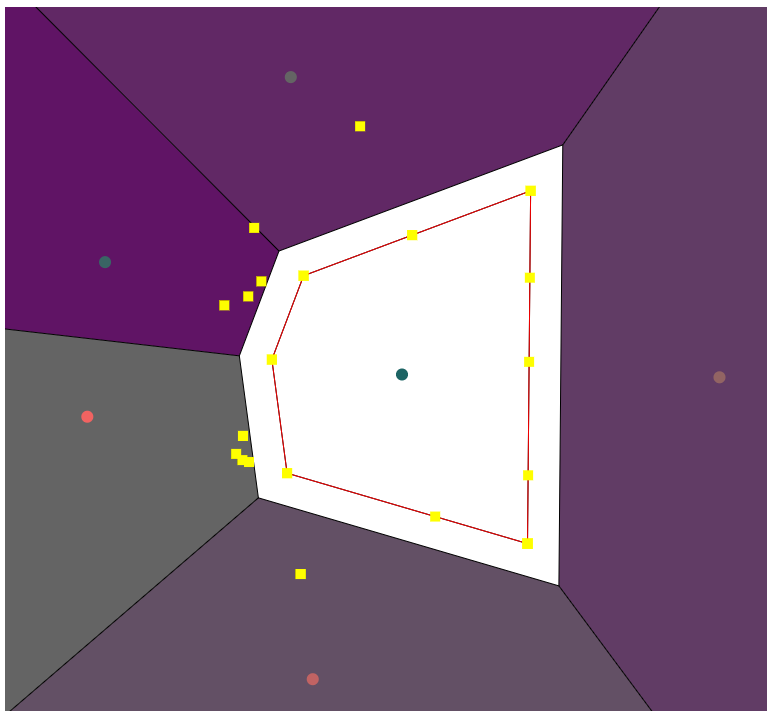
Projected Points
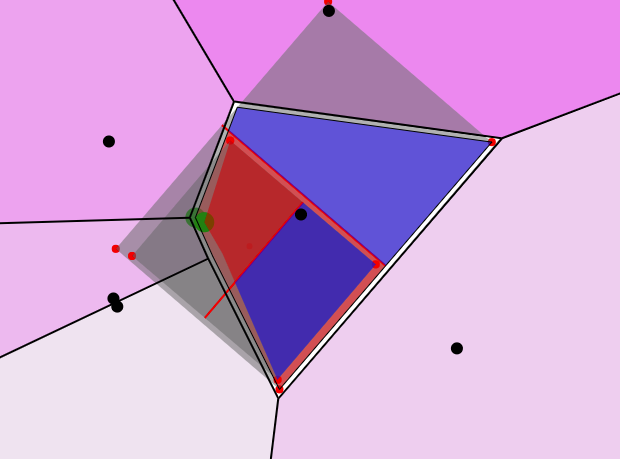
Object Oriented Bounding Box
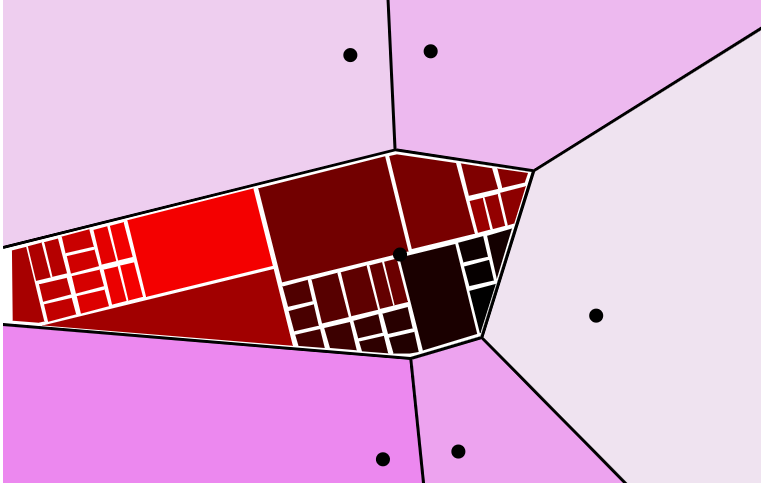
Polygon split into uneven plots.
Polygon split into relatively homogeneous plots.
Solved the weird Delaunay problem I was having the last few weeks, and applied OBB splitting to cells at scale...
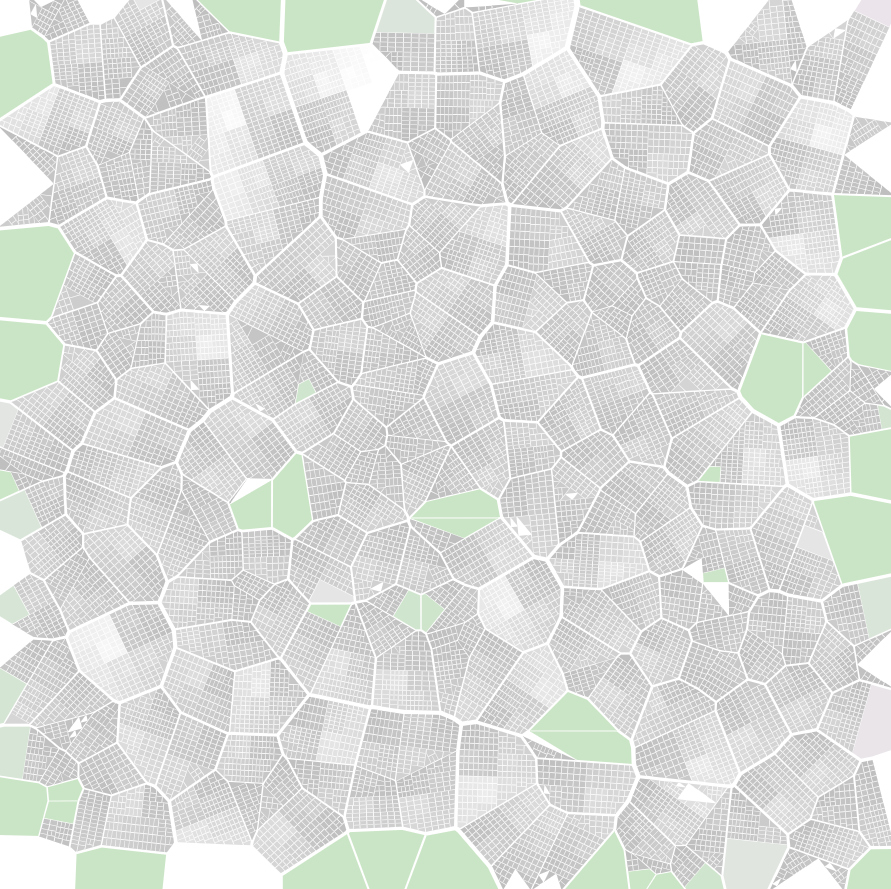
21,000+ plots in less than a second. Programming is wild.
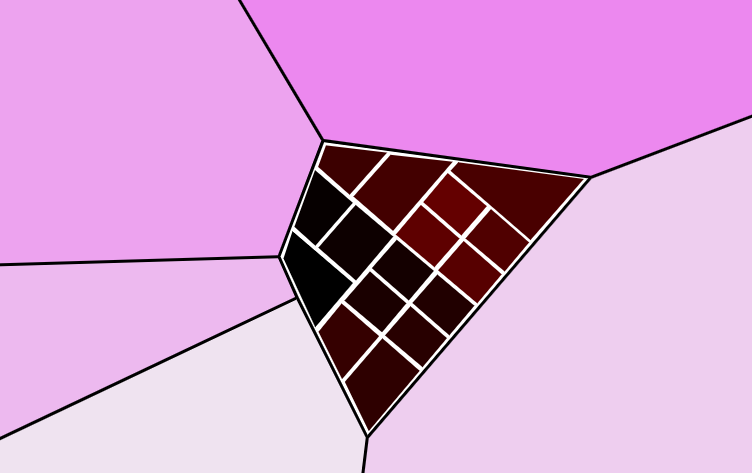
In truth, the algorithm doesn't work 100%. Some chunks, for whatever reason still don't get split down into smaller plots. Fortunately for me, that adds a nice diversity to the homogeneity of the building plots, and when drawing them, I have them draw like fields / parks instead of plots.
The big step now is getting these plots to display in THREEjs. The plan was to have plots generate dynamically as the city grows, but I think that might be too much optimization for now. The plan is to "bake" in all these plots, and have the city grow from there. Depending on the placement algorithm, the city could need expanding very soon. I figure if the dynamic placement is going to stop me from creating the rest of the placement algorithm and all in time, it's best to focus on getting something workable right now.
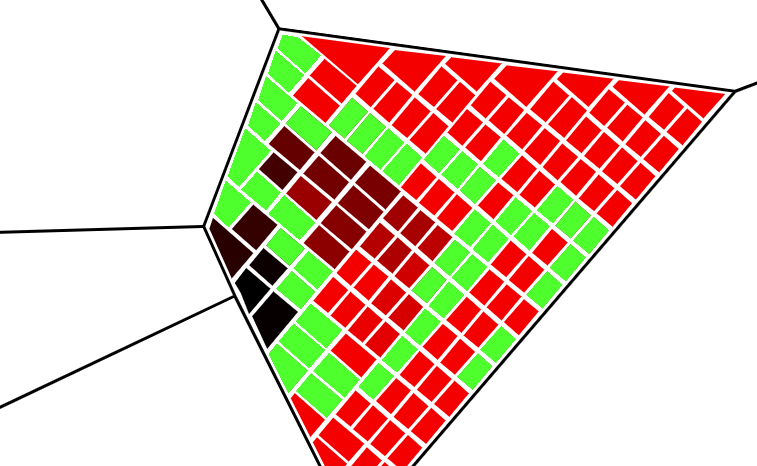
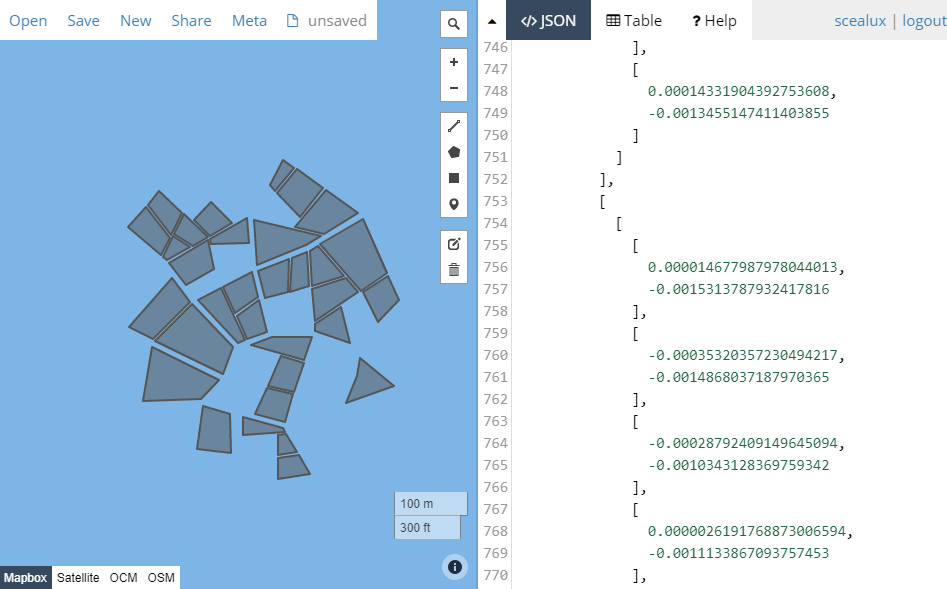
That being said, once I get the city to display with THREEjs, there's two layers to connect before buildings are placeable: The resource placer (takes in information about a resource and spits out an X, Y coordinate) and the 3D map (Using Delaunay Triangulation, and the library's "delunay.find()" method, the map can use the coordinate from the placer to identify a plot to home the resource at.). I've tested delunay on plots to confirm it works how I expect:
After that is Firebase integration and UI; neither is trivial but they're more in my wheelhouse than 3D graphics have been.
Week 8: 2/25 -> 3/3
I posted for this week but I'm not sure where it went?...
Week 7: 2/18 -> 2/25
This week involved getting back into procedural generation and tackling d3-delauany all over again. Last time I stopped working on the Voronoi pattern after I ran into issues being able to iterate through cells. I began this week by tackling that again, but instead of laying out sites randomly, I used a seeded random number generator so when I found an issue I could reproduce the same circumstances it occurred under.
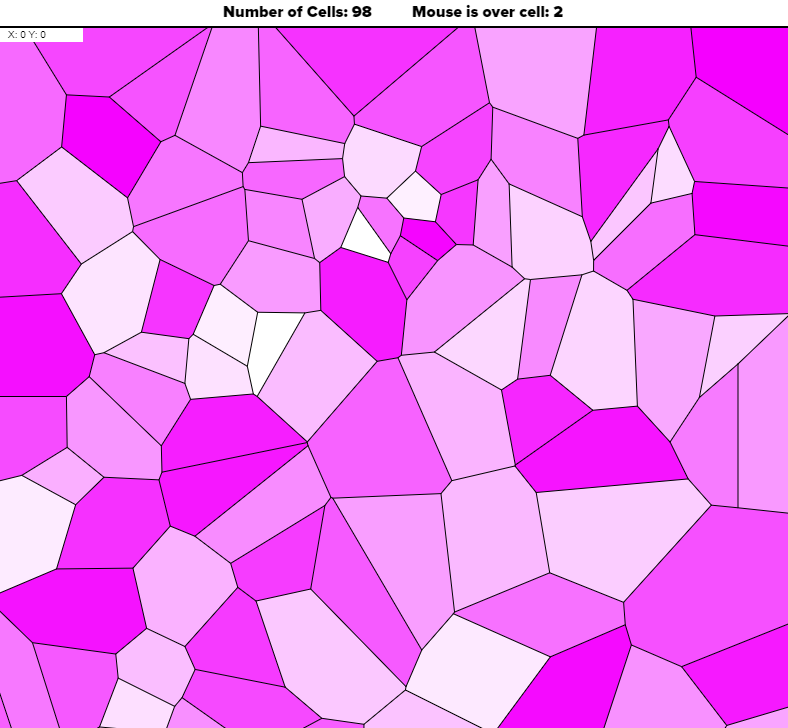
White cells in in the photo above are not being iterated over by the included methods...
I still had issues iterating through every cell, but created a new project using the available methods to determine and separate infinite cells from the rest. This way, when generating the city, I can select the infinite cells and their neighbors as variable cells and not generate building plots there.
Then came the issue of offsetting the cells inwards to separate cells and then further divide the cell into building plots. (the last step).
I didn't quite make it to the end of that goal, but got to the beginning of the Object Aligned Bounding Box (OBB) plot-splitting method. These implemented together are here: https://71y5k.csb.app/

Overall, I'm very happy with the results, this week involved learning some basic linear algebra, converting formulas to code and testing everything over and over again. As the weeks go on, I'm loving diving deeper into web development and coding in general.
Week 6: 2/11 -> 2/18
Firebase and Project Restructuring
This week, I continued working on the placement algorithm but kept running into issues. After spending the entire weekend with few victories, I decided it was time to rethink where I was. The way I'd worked up until now was based around iterative tests. These projects had gone well because they started at a basic level then increased in difficulty with every subsequent test. The most clear example is starting THREE.js with displaying and moving a box, creating a grid of movable boxes, creating a single interactive custom geometry, creating a small city of custom geometry with shadows.
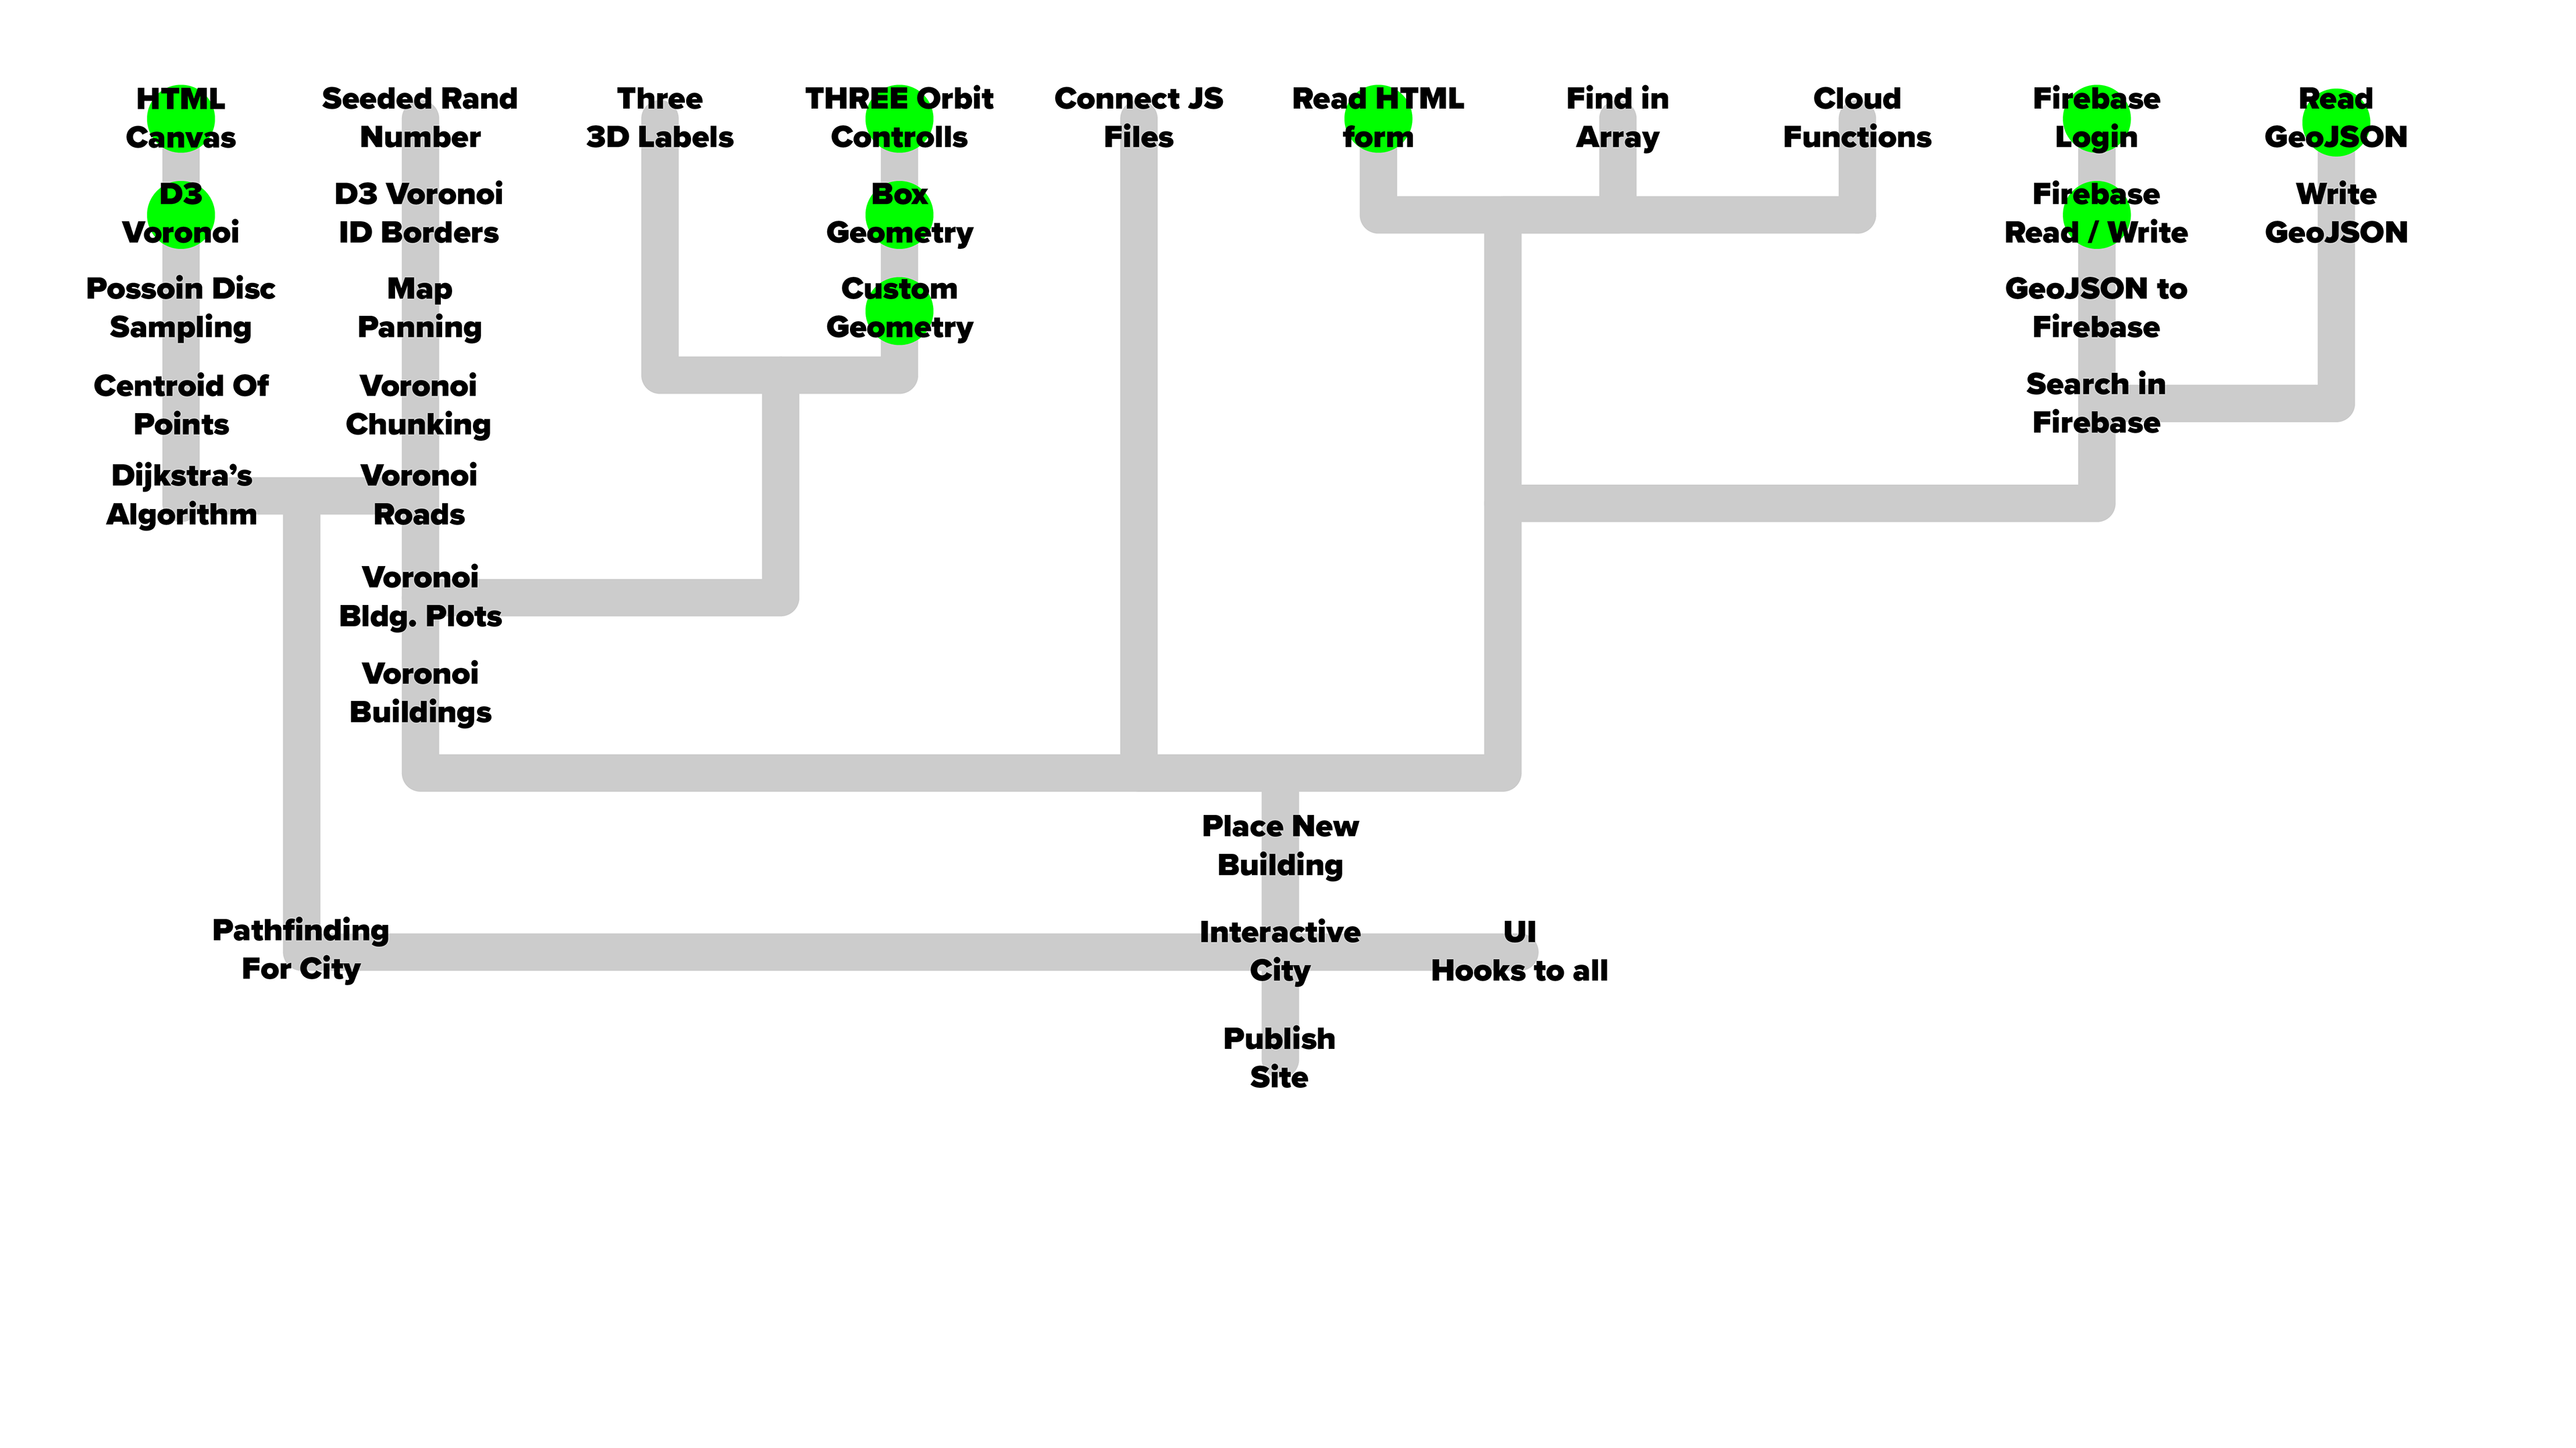
The problem I think I've been running into these last few weeks is trying to complete pieces of the project out of sequence. I went through and broke down larger pieces into their component parts to reassess my position. Laid out, it's clear to see why the "Place New Building" element was so difficult: it relies on elements easiest completed independently. That's all to say, before tackling that I have many smaller sub-tasks to finish.
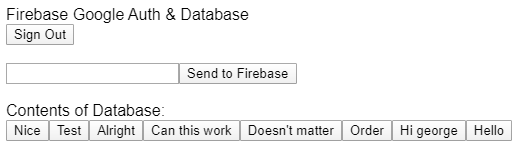
Though I don't feel great about the confusion of the last two weeks, having this new format for looking at the the remaining tasks makes the project feel more manageable. After setting up the chart below, I began work on Firebase, completing Login and Read / Write in a couple of hours. Off to a good start.
Link to Process Presentation.
Week 5: 2/4 -> 2/11
Mentor Review & Placement Algorithm
This week, I worked on creating and implementing an extensible solution for placing new buildings in the city. Coming in from last week, I was pretty sure I could get it done, but ran into more issues than I'd imagined. My original plan involved creating a Delauany Triangulation from a random scattering of points. From there, I'd create a Voronoi pattern, the cells of which being neighborhoods / places for new buildings to spawn. I got wrapped up in the idea and made it pretty far down that track before realizing some critical problems. The edge cells of a Vornoi pattern are infinite. This isn't a huge problem, there are other algorithms for limiting the edges to a specific canvas. However, the larger issue was that new cells can change the shape of existing cells. you can see how that works in my demo on CodeSandbox (doubleclick to place a new Voronoi "site") .

The problem that creates is when a new site is added, any building that may have been in one cell might either become part of a different cell, or may then lie on the dividing line between two cells. The original plan was to have those dividing lines be rendered as roads in the city, which would make those buildings problematic.
With that in mind, I had to rethink the process. I've instead decided to build the city out without that overlying structure. The new model works basically like this:
AddNewResource {
- Read in the values of all possible influences (title, host, tags, tool, topic, category)
- Find “Tag Capitals” for those influences (Tag Capitals are the anchors for each distinct influence)
- Calculate the centroid of the influence points
- Place the new foundation there
}
In practice it's more complicated than that, but I've spent the last day or two away from the computer, thinking through the process on paper. I've come up with this pseudo-code I'm in the process of implementing right now.
Additionally, this week I was also intending to have buildings with tags that rotated to face the camera. Because I didn't get the preliminary step done, I ended up not implementing this either. Feeling behind after this week but I'm going to work to catch up by next week.
Mentor Review
For my mentor review, I talked to Zach about the progress I'd made since we last talked.
A: Do you think I’m on the right track?
Z: Mainly I have questions.
1. What are you doing to inform whether people will actually use this interface for an “online learning community”. What is the evidence that they will or, even, might.
2. Are you primarily focusing on organizing a learning community or could your tool be used as a new way to organize many types of catalogs of information? What distinguishes the results of your goal from the results of similar goals?
3. How do Voronoi compositions add to the user experience? For example, are there other “architectural” conventions that support the narrative of a “place” where people navigate intuitively?
4. Are you on track to reach the MVP (minimum viable product) to demonstrate your platform by May? Have you listed those priorities? How are you setting those priorities?
A: What do you think of the progress I’ve made so far?
Z: I think you have an interesting dive into data visualization, ongoing. The original thesis had something to do with ‘gamifying’ the organization/navigation specifically of online learning resources. I’m not sure what your priority is at this point but the potential is definitely still there. One thing that would be disappointing to see would be you having to ‘post-rationalize’ why you did what you spent the semester doing. This is something most designers, myself included, are guilty of; we trade the rigorous work for the thing we’re excited about or already good at. Completing complex projects, especially as an individual, means the project is boss. You work...for it. Which means you have to clearly define what “it” is. It’s all about discipline, which I know you have. Take some time to reflect and evaluate your next move.
Abraham Salvador Jones
For the other expert, I explained my idea and progress to my teacher for School and Society, Abraham Jones.
For the other expert, I explained my idea and progress to my teacher for School and Society, Abraham Jones.
He's a PhD student in the School of Education.
After explaining the idea, I wrote down some of the following conversation:
- Abe thought buildings and cities generated over a real map could add opportunities for historical events & locations to be explored in-context.
- Imagined individual cities for users, they build larger as the person learns more
- For different districts, have relevant experts.
- Think about how big the city can practically get, does it make sense to split them into different categories.
- Overall, he thought the idea was compelling, but sounded like he needed to interact with it to get a better feel for it.
He offered to set up a meeting between myself and 4-5 education experts. We decided to try that closer to spring break when the MVP of my idea is functional. Then, I can sit down with the experts, explain my idea and get their first impressions as they navigate the city. That way, their input could help conceptualize where the platform heads as it expands.
Week 4: 1/28 -> 2/4
3D City + Topic Based Node Grouping
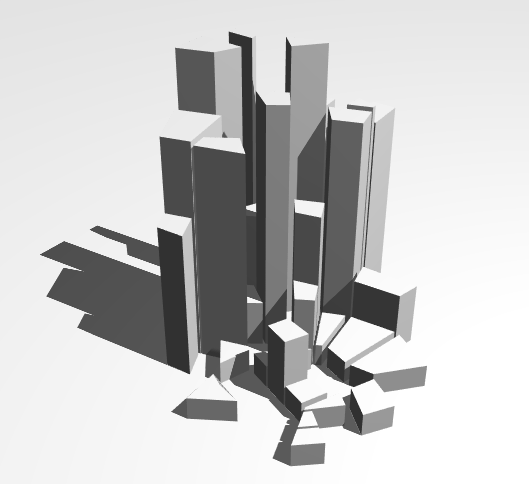
This week, I translated the 2D GeoJSON reader to create a city in Three.JS. I learned a lot about how custom geometry works and how to create an extensible visualization for geographic data. I took it a bit further and learned some about shadow maps in Three.JS as well; I think they add a lot to the visuals.
From there, the goal was to prototype ways that the city might expand, and how the foundations for new buildings would be placed understandably. To do this, I created a simple visualization, where users can add new nodes with a few defining characteristics. They can select the method by which the new nodes are placed and add nodes with the same parameters to see how the city might expand. The most difficult part of this, was deciding how new nodes would be placed and how weighting could occur.
To keep things simple, I'm assuming each new node will have three referential pieces of information to inform its placement (3 tags, 2 tags + tool, category + tool + topic, etc.) My initial thought was having "tag capitals" (locations for certain tags), be anchor points, create circles of various radii around the points and find where the intersected to place the new point. It was along the lines of triangulation but felt a little over-complicated. Next, I looked into simple spring functions, where each could anchor to a "tag capital" and the rigidity / rest length of the spring could further weight placement. I didn't end up getting that to work (though I'm still looking to try it), but moved on to centroid and weighted centroid placement. They're easy to calculate and implement for triangles. For the weighted version, I'd assign weights to each of the informing pieces of data and, after the centroid is found, the weights pull the point off the centroid and toward them proportionally. The demo of that is also on Code Sandbox.
Week 3: 1/21 -> 1/28
City generation cont. + Firebase Login
I dove deeper into procedural city generation and research around it. I spent much of the week trying to complete an algorithm for placing Voronoi "seeds" across a grid evenly but randomly. I didn't get that complete, but in looking into it I ran into some other approaches for city generation. After learning about the Wave Function Collapse Algorithm and other methods for procedural generation, I realized a need create separate, modular layers for the final website.
For this, I decided to have the city stored in GeoJSON format, a common format for mapping applications. One of the generators I liked (Medieval City Map Generator) has an option to export maps in the GeoJSON format.
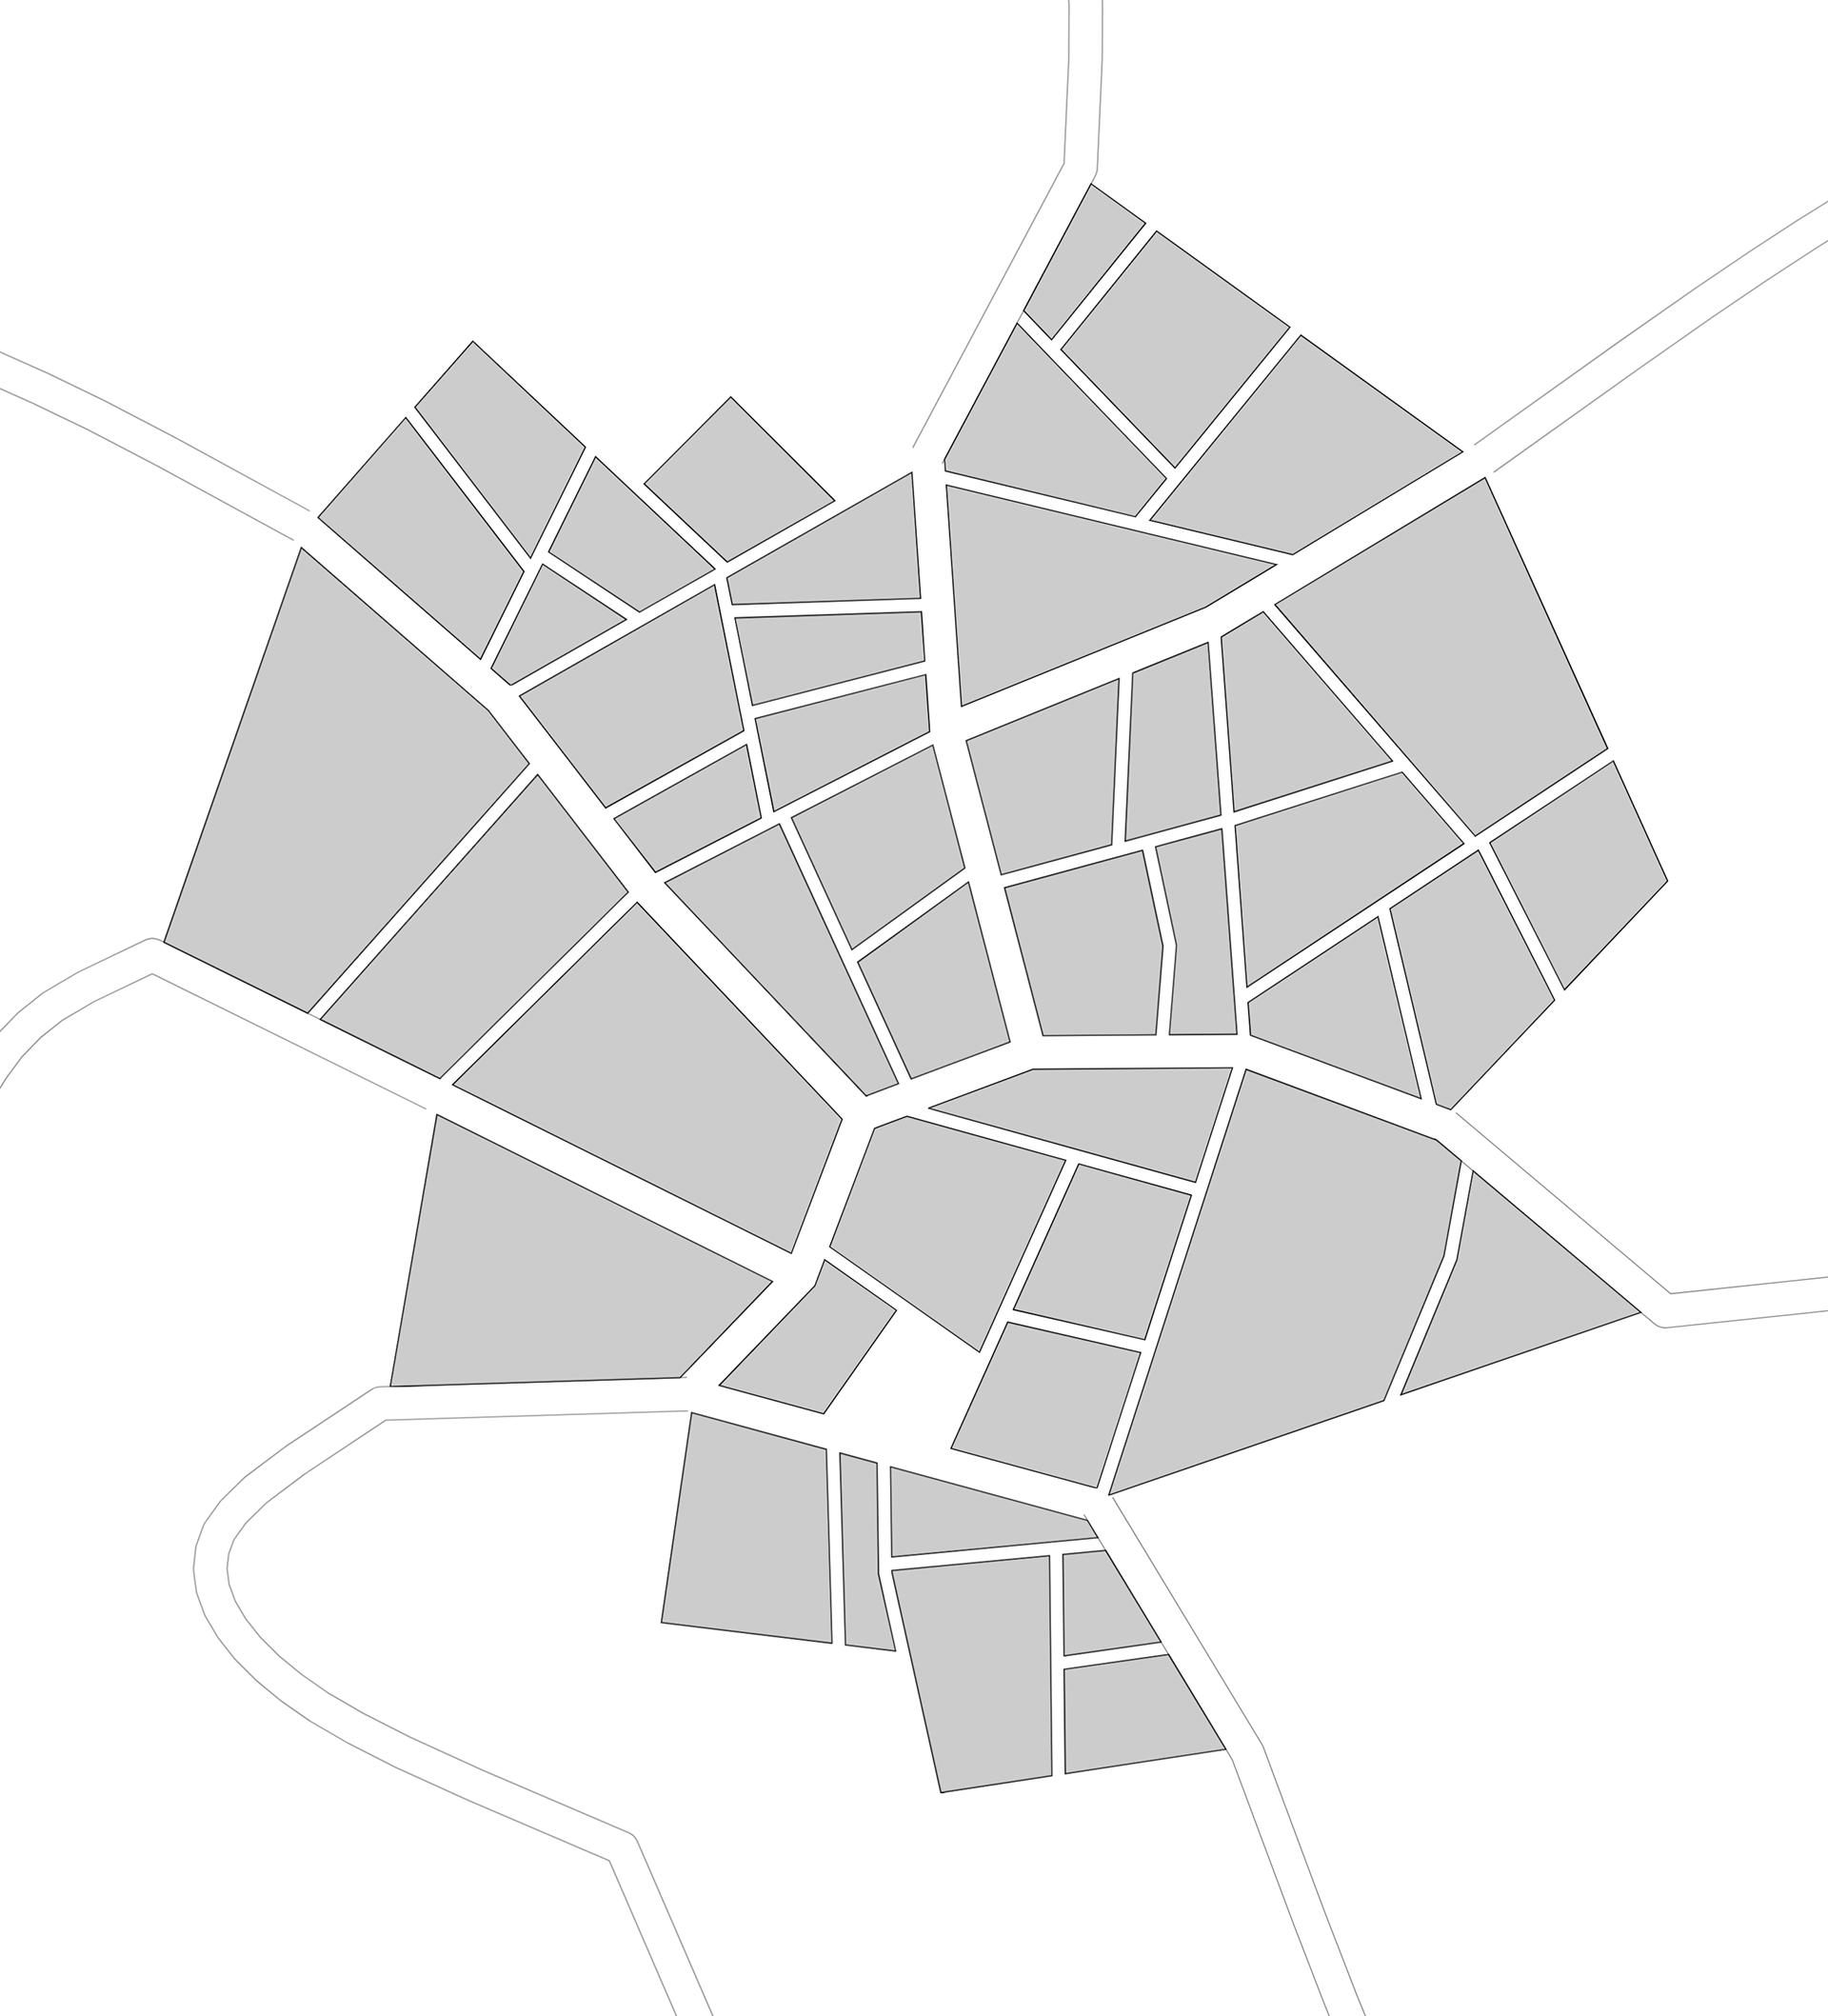
Exported Map
Removing extraneous information from the geoJSON file
I exported one of those maps, reduced it to just four-sided buildings and spent way too much time getting the JavaScript file to read the JSON. Then, information from the JSON file is used to build the city.
This process means that the city visualization becomes interchangeable, built on top of the GeoJSON standard. I didn't make it to adding Firebase login to the interface but I feel confident in focusing on the city visualization. I believe it is important to the overall experience and spending time polishing its look and navigation will contribute to the success of the platform.
Week 2: 1/14 -> 1/21
First week of classes, building out the interface and setting up the city visualization.
In exploring how to set up the city visualization, I realized I was running into the kind of problem some people dedicate their master's thesis to. There are a couple dozen procedural city generators online, mainly for use in creating fantasy worlds for games.
This example by watabou creates a layout most similar to what I'm wanting to make for fishcity. The creator has since gone on to create a 3D visualizer for it called Toy Town. This visualizer is great for prototyping experiences with the city. I hadn't previously considered an isometric view of the town, but a setting in Toy Town provides an excellent visual for that. Being able to switch between views and fly through the city is great for getting a feel for navigation.
In looking through the project, I've been able to find some of the code for the project and a couple high-level explanations of the algorithms they used.
I've spent time this weekend trying to build off of other examples of procedural generation, but have realized it's going to be a problem that takes longer than expected.
In the last day or so I've shifted to making sure I can create / modify custom geometry in THREE.js. That way, I know the form my city generator has to export information in to be read and displayed by THREE.js.